
精通
英语
和
开源
,
擅长
开发
与
培训
,
胸怀四海
第一信赖
精通
英语
和
开源
,
擅长
开发
与
培训
,
胸怀四海
第一信赖
锐英源精品开源心得,转载请注明:“锐英源www.wisestudy.cn,孙老师作品,电话13803810136。需要全文内容也请联系孙老师。
As realtime applications become more complex, the availability of event tracing mechanisms becomes more important in order to perform run-time monitoring. Recently, IEEE has introduced tracing to the facilities defined by the POSIX standard. The result is called the POSIX Trace standard.
随着实时应用程序变得更加复杂,为了执行运行时监控,事件跟踪机制的可用性变得更为重要。最近,IEEE介绍了POSIX标准定义跟踪设施。结果被称为POSIX跟踪标准。
Tracing can be defined as the combination of two activities: the generation of tracing information by a running process, and the collection of this information in order to be analysed. The tracing facility plays an important role in the OCERA architecture. Besides its primary use as a debugging tool, the tracing component jointly with the applicationdefined scheduler component are the key tools to build fault-tolerance mechanisms.
跟踪可以定义为两个活动的结合:由一个运行过程生成跟踪信息,收集这些信息来分析。跟踪设施在OCERA体系结构起着重要的作用。除了其作为调试工具主要用途,应用程序定义调度组件和跟踪组件联合,是构建容错机制的重要工具。
Low-level RTLinux. It is distributed as a patch. 低级RTLinux。它是作为一个补丁分发。
The ptrace component supports all the Trace and the Trace Event Filter options defined in the standard, subject to some minor changes and limitations. Overall, this allows the programmer of a realtime application in RTLinux to perform filtered on-line tracing of events at run time. Since RTLinux concurrency is limited to lightweight processes, this implementation can not support the Trace Inheritance option. Also, the Trace Log option has not been implemented due to the lack of permanent storage subsystem.
ptrace组件支持所有跟踪和跟踪事件过滤器选项,这些选项在标准中定义,但有一些小的改动和限制。总体来说,这允许使用RTLinux实时应用程序的程序员运行行间跟踪事件的过滤。自从RTLinux并发仅限于轻量级进程,这一点实现不支持跟踪继承选项。此外,跟踪日志选项尚未实施,由于缺乏永久存储子系统。
The following is the full list of the functions corresponding to the TCP which are supported (this particular subset of the trace functions is represented as (TC) in Figure 5-1): 下面是完整列表功能对应TCP的支持(这个特定的子集跟踪函数表示为(TC)图5 - 1):
int posix_trace_attr_destroy(trace_attr_t *);The target or traced process (TP) is always composed by a set of real-time tasks executed by the RT-Linux scheduler and, optionally, some Linux user processes. The RTL-PTtrace system provides both levels with the two functions which the standard defines to this role. These functions are:
目标或追踪过程(TP)总是由一组实时任务组成,这些任务通过RT-Linux调度器执行和可能地某些Linux用户进程。RTL-PTtrace系统提供两种水平级别的函数,这些函数和标准定义的角色对应。这些函数是:
int posix_trace_eventid_open(const char *restrict, trace_event_id_t *restrict);
void posix_trace_event(trace_event_id_t, const void *restrict, size_t);
The full list of functions available for the (TAP) (see Figure 5-1) at either of the application levels is: 完整的函数列表(TAP)(见图5 - 1)可用于在应用程序中的任何一个水平是:
int posix_trace_attr_getclockres(const trace_attr_t *, struct timespec *); In a typical RTLinux application, the programmer usually splits the application code in a set of realtime tasks (executed by the RTLinux executive) plus one or more Linux user processes (executed by the Linux kernel). These two parts will be hereafter referred to as the applications s RTLinux side and Linux side. If some trace support has to be given to the two sides, the RTL-PT system has to be present at both. Therefore, we have implemented RTL-PT as two cooperating trace subsystems, one at each level:
在一个典型的RTLinux应用程序,程序员通常将应用程序代码分开放在一组实时任务(由RTLinux行政执行)加上一个或多个Linux用户进程(由Linux内核执行)。这两个部分从此将被简称为RTLinux和Linux。如果一些跟踪支持必须在双方中,RTL-PT系统必须在两方出席。因此,我们已经在每个级别都实现了RTL-PT,作为两个协同跟踪子系统::
a. RTLinux trace subsystem. The RTL-PT support at the RTLinux level has been integrated into the RT-Linux scheduler (module rtl_scheduler.o). The trace support is then always available to the RTLinux application, whether or not the ap- plication wants to use it. Nevertheless, its overhead in the case of not using it is practically null.
A、RTLinux的跟踪子系统。RTLinux层面支持的RTL-PT已经被集成到RT-Linux调度(模块rtl_scheduler.o)。跟踪支持总是适用于RTLinux应用程序,只考虑应用是否想使用它。然而,其开销在不使用的情况下几乎为零。
All the data structures necessary to keep the entire tracing status are created and managed inside this module. These data structures include among other: control information, the set of event types registered for the target and all the active streams with its currently stored events.
所有的数据结构必须保持整个跟踪状态,这个状态在这个模块中进行创建和管理。这些数据结构包括其他:控制信息,为目标注册的事件类型集和所有与当前存储事件相关的活动流。
b. Linux trace subsystem. Maybe the most natural way to support POSIX Trace at the Linux level could have been to modify the Linux kernel by adding the required facilities as new Linux system calls. However, we chose not to do this for two reasons: firstly, because then the support would have been completely coupled to a particular version of the Linux kernel, and secondly because the actual functionality to be supported (see below) did not actually require such ambitious implementation. As a result, the decision was to implement this subsystem as a library to be linked with any Linux process that required trace support (called libposix trace.a). This library is made available in Linux when RTLinux (with the RTL-PT system) is compiled. Internally, this library communicates with the RTLinux scheduler (where the RTLinux trace subsystem is) in order to make both systems work in a synchronised manner. This communication is done by several dedicated RT-FIFOs.
B、Linux跟踪子系统。也许最自然的方式来支持POSIX跟踪,在Linux级别可以通过添加所需修改的Linux内核设施达到新的Linux系统调用。然而,我们选择不这样做的原因:首先,因为这样会被完全耦合,进而只支持特定版本的Linux内核,其次是因为实际的功能支持(见下文)实际上并不需要这样的实现。因此,决定是为了实现这个子系统作为库来使用,有关任何Linux过程需要跟踪支持的库称为libposix trace.a。这个库是在Linux可用RTLinux(RTL-PT系统)被编译。在内部,这个库和RTLinux调度器通信(对应RTLinux跟踪子系统)来使两个系统以同步方式工作。这种通信是通过几个专用RT-FIFOs实现。
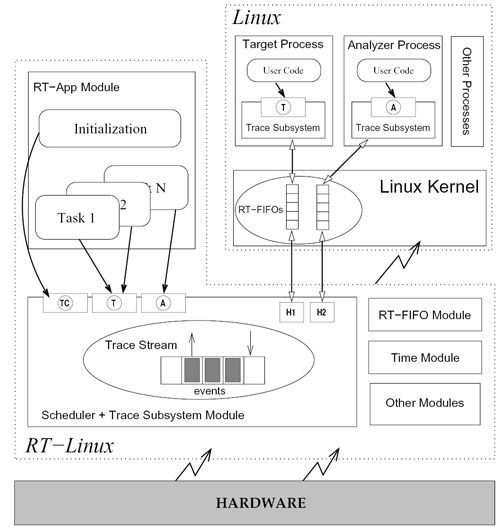
Figure 5-1. POSIX跟踪系统的概述
Although several simple functionality tests has been developed, the best way to test this component is by using it. The POSIX trace was successfully used during the development of the RTLGnat component.
虽然有几个简单的功能测试,已经研制成功,测试该组件的最好方法是使用它。POSIX跟踪成功开发期间使用RTLGnat的组件。
The main overhead introduced by the trace system is due to the amount of main memory used to store the logged data. There is little margin to improve the implementation. Some preliminary results show that the overhead of tracing an event is in the range from 100 to 500 nanoseconds.
主要跟踪系统引入的开销是由于主内存的数量用于存储记录的数据。有小幅度提高实现。一些初步结果表明,跟踪事件的开销是在从100到500纳秒的范围内。